Token Supply
- Total Supply
- 23.76B
- Max Supply
- —
Price Today
- Current Price
- $1.06
- Price Change (24h)
- 5.95%
- Low 24h / High 24h
- $1.00 – $1.04
- Market Cap Rank
- #9
Market Statistics
- Market Cap
- $25,203,689,129.00
- Fully Diluted Market Cap
- $25,203,689,129.00
- 24h Volume
- $1,626,122.00
- Volume / Market Cap
- 0.00006
All-time Price Records
- All-time HighOct 5, 2026
- $1.08 1.35%
- All-time LowOct 31, 2025
- $0.1554 582.79%
- 7D Range
- $1.00 – $1.08
- 30D Range
- $1.00 – $1.08
- 90D Range
- $1.00 – $1.08
- 1Y Range
- $0.2340 – $1.08
Figure Heloc Quick Converter
Estimate the current value using the latest available market price.
Figure Heloc Markets Exchange Data
Compare live prices and trading volume across major exchange markets.
| # | Exchange | Pair | Last Price | 24h Volume | Trust |
|---|---|---|---|---|---|
| 1 | FIGR_HELOC/USD | $1.04 | $2,468,753.00 | — |
Historical Data
| Date | Price | Market Cap | Volume |
|---|---|---|---|
| Oct 10, 2026 | $1.00 | $23,784,545,220.29 | $527,420,477.84 |
| Oct 10, 2026 | $1.00 | $23,747,987,881.02 | $697,177,870.11 |
| Oct 9, 2026 | $1.03 | $24,390,146,003.33 | $28,009,303.45 |
| Oct 8, 2026 | $1.02 | $24,049,042,064.42 | $50,748,838.61 |
| Oct 7, 2026 | $1.04 | $24,450,446,473.68 | $45,695,236.06 |
| Oct 6, 2026 | $1.03 | $24,265,482,430.33 | $22,362,365.79 |
| Oct 5, 2026 | $1.08 | $25,249,687,772.23 | $454,198.71 |
| Oct 4, 2026 | $1.07 | $25,085,184,250.79 | $2,809,171.72 |
| Oct 3, 2026 | $1.04 | $24,375,580,576.68 | $34,721,521.80 |
| Oct 2, 2026 | $1.02 | $23,928,291,031.64 | $24,228,582.09 |
| Oct 1, 2026 | $1.03 | $23,993,355,615.37 | $601,366,679.41 |
| Sep 30, 2026 | $1.01 | $23,583,047,235.54 | $565,491,739.88 |
| Sep 29, 2026 | $1.00 | $23,304,824,284.93 | $346,881,170.73 |
| Sep 28, 2026 | $1.00 | $23,199,148,076.62 | $157,672.45 |
| Sep 27, 2026 | $1.06 | $24,608,999,256.31 | $1,961,772.68 |
| Sep 26, 2026 | $1.03 | $23,876,332,824.38 | $131,809,448.97 |
| Sep 25, 2026 | $1.03 | $23,686,884,497.39 | $479,195,887.61 |
| Sep 24, 2026 | $1.03 | $23,657,592,278.75 | $38,657,621.01 |
| Sep 23, 2026 | $1.03 | $23,696,678,227.94 | $184,295,630.11 |
| Sep 22, 2026 | $1.01 | $23,076,344,194.74 | $50,677,481.08 |
| Sep 21, 2026 | $1.00 | $22,769,853,674.04 | $3,736,460.51 |
| Sep 20, 2026 | $1.00 | $22,770,089,034.75 | $3,736,499.13 |
| Sep 19, 2026 | $1.03 | $23,423,152,231.95 | $106,496,390.03 |
| Sep 18, 2026 | $1.03 | $23,305,965,309.21 | $207,516,910.14 |
| Sep 17, 2026 | $1.03 | $23,217,188,973.77 | $106,634,503.63 |
| Sep 16, 2026 | $1.00 | $22,693,530,288.92 | $786,746,373.85 |
| Sep 15, 2026 | $1.03 | $23,330,988,972.45 | $21,735,215.36 |
| Sep 14, 2026 | $1.02 | $23,034,964,908.79 | $63,204.86 |
| Sep 13, 2026 | $1.00 | $22,551,139,650.15 | $50,041.18 |
| Sep 12, 2026 | $1.03 | $23,222,566,856.01 | $300,994,753.92 |
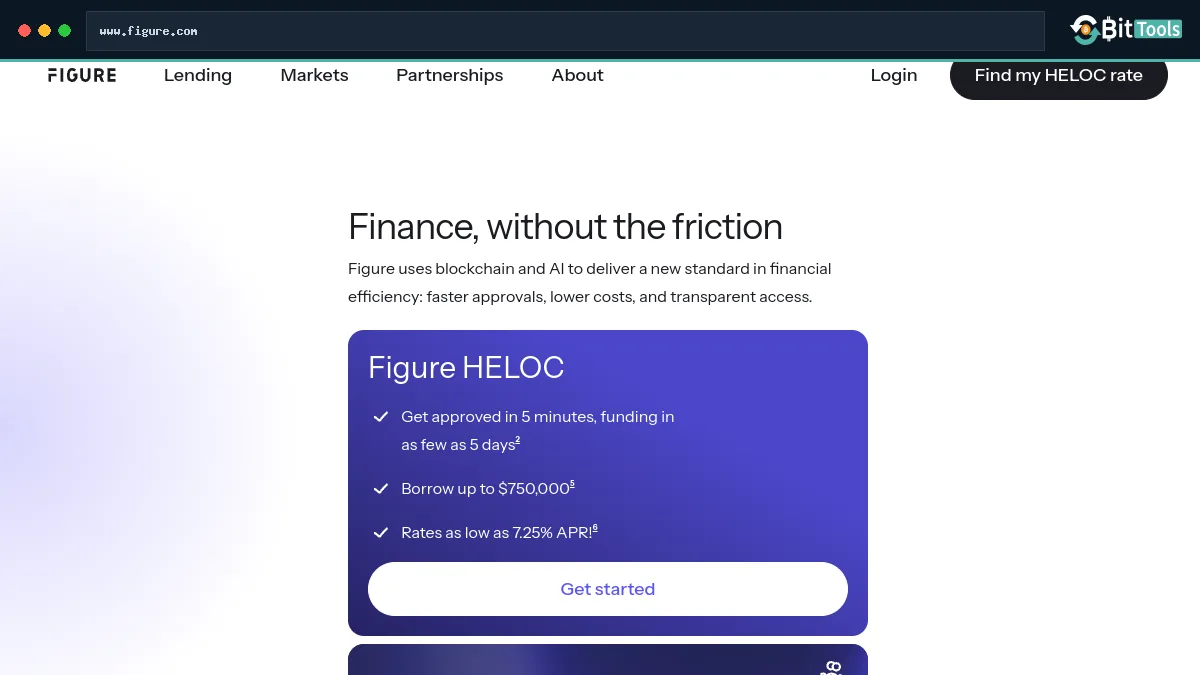
Figure Heloc Website Preview
Visit www.figure.com
About Figure Heloc
This project is building the foundational protocol layer for institutional debt markets on blockchain. Powered by Provenance Blockchain, Figure Connect and Figure Markets are transforming the way loan assets are originated, traded, and settled. Figure Connect functions as a primary market for credit—standardizing and tokenizing debt assets such as HELOCs and private credit into composable on-chain formats. Figure Markets acts as a secondary trading venue, enabling 24/7 settlement of these digital loan assets through decentralized custody, with support for both crypto and fiat on/off ramps. Together, they offer an integrated protocol for real-world asset finance, with deep roots in the lending ecosystem.