BTC $62,492.00 −3.43% ETH $1,763.99 −2.69% USDT $0.9990 −0.02% BNB $578.62 −2.39% USDC $0.9996 −0.00% XRP $0.9638 −0.81% SOL $72.91 −1.30% TRX $0.3090 +0.46% FIGR_HELOC $1.01 +0.52% STETH $1,796.44 −1.86% HYPE $66.36 −4.11% ZEC $908.29 −4.19% XMR $500.55 −1.13% BSC-USD $0.9993 −0.02% BTC $62,492.00 −3.43% ETH $1,763.99 −2.69% USDT $0.9990 −0.02% BNB $578.62 −2.39% USDC $0.9996 −0.00% XRP $0.9638 −0.81% SOL $72.91 −1.30% TRX $0.3090 +0.46% FIGR_HELOC $1.01 +0.52% STETH $1,796.44 −1.86% HYPE $66.36 −4.11% ZEC $908.29 −4.19% XMR $500.55 −1.13% BSC-USD $0.9993 −0.02%
Active Cryptocurrencies21,487
Markets1,529
Total Market Cap$2.16T
24h Volume$70.18B
BTC Dominance58.0%
#462 Decentralized Finance (DeFi)

Chainflip FLIP

Chainflip Price
$0.4756 1.95%
$-0.00944483 · 24H 0.00000763 BTC 0.00026957 ETH
Low$0.4726
High$0.4856
Market Cap Rank#462
Market Cap$41,001,655.00 2.01%
24h Volume$144,832.00Volume / Market Cap 0.0035
Fully Diluted Market Cap$41,001,655.00
Circulating Supply86.22M FLIP100.0%
Performance

Chainflip Price Performance

1H 0.16%
24H 1.95%
7D 21.40%
14D 46.63%
30D 54.54%
200D 134.90%
1Y 13.60%
Supply

Token Supply

Circulating Supply86.22M FLIP
100.0% Circulating Supply
Total Supply
86.22M
Max Supply
—

Price Today

Current Price
$0.4756
Price Change (24h)
1.95%
Low 24h / High 24h
$0.4726 – $0.4856
Market Cap Rank
#462

Market Statistics

Market Cap
$41,001,655.00
Fully Diluted Market Cap
$41,001,655.00
24h Volume
$144,832.00
Volume / Market Cap
0.00353

All-time Price Records

All-time HighMar 7, 2024
$9.48 94.98%
All-time LowApr 3, 2026
$0.1909 149.09%
7D Range
$0.3918 – $0.4773
30D Range
$0.2994 – $0.4773
90D Range
$0.2869 – $0.4773
1Y Range
$0.1964 – $0.4773
Calculator

Chainflip Quick Converter

Estimate the current value using the latest available market price.

Chainflip

Chainflip Charts

Chart data through 18 Nov 2026 · 21:48 UTC

Chainflip

About

About

About Chainflip

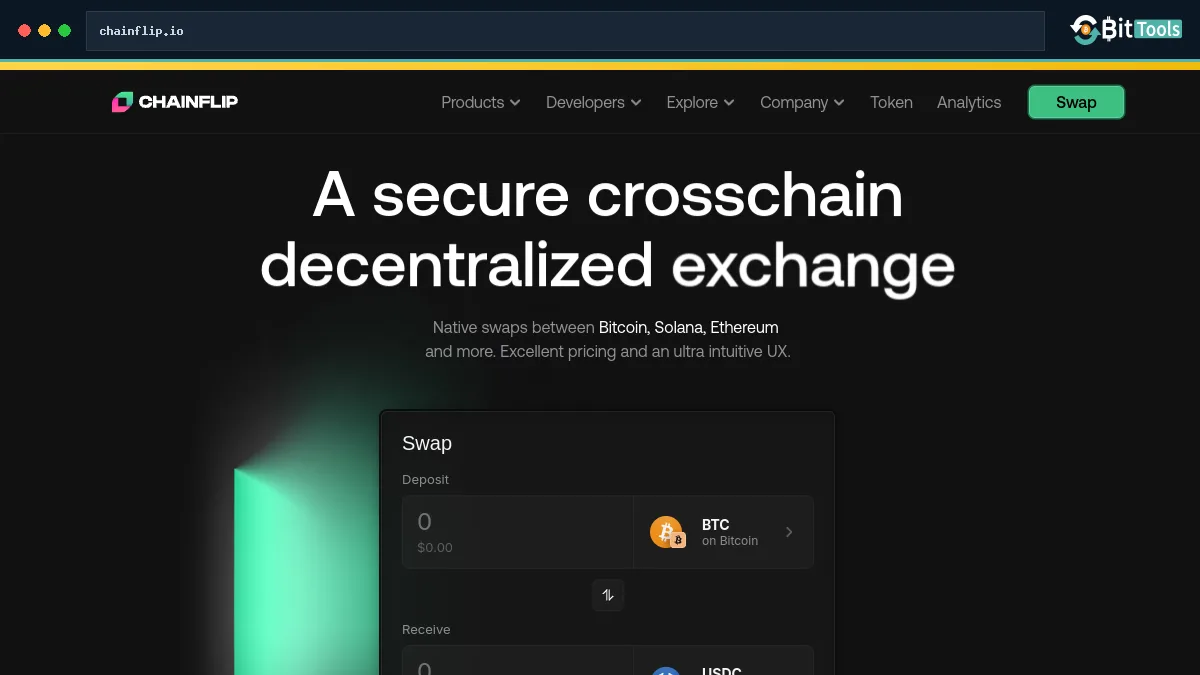
Chainflip is a decentralised, trustless protocol that allows users to easily exchange cryptocurrency assets across a range of networks and blockchains without losing custody of their assets in the process. The Chainflip protocol allows users to swap assets between major blockchains without any wrapped tokens, traditional bridging, and at extremely competitive pricing using a novel and unique ‘Just-inTime’ based Automated Market Maker, dubbed the JIT AMM. It is totally generalised, decentralised, and can be integrated with any chain using any transaction type. The protocol is secured by a set of 150 validators staking Chainflip’s native FLIP token. FLIP is primarily a utility token. Validators require FLIP in order to stake, and in turn are rewarded in FLIP. Value is returned indirectly to Validators through protocol fees. Additionally, every swap conducted on the platform results in the automatic buying and burning of FLIP tokens through the liquidity pool system, which puts deflationary pressure on the network as trading volume increases.


Markets

Chainflip Markets Exchange Data

Compare live prices and trading volume across major exchange markets.

8 Pairs
Price History

Historical Data

30D
DatePriceMarket CapVolume
Nov 18, 2026$0.4756$41,001,871.66$144,832.14
Nov 18, 2026$0.4773$41,152,705.95$125,850.40
Nov 17, 2026$0.4710$40,631,296.15$158,242.43
Nov 16, 2026$0.4364$37,681,107.85$95,953.48
Nov 15, 2026$0.4142$35,790,585.65$159,574.81
Nov 14, 2026$0.4275$36,963,723.23$74,286.20
Nov 13, 2026$0.4179$36,162,538.56$164,328.66
Nov 12, 2026$0.3918$33,927,948.82$86,833.60
Nov 11, 2026$0.3801$32,945,851.53$94,260.49
Nov 10, 2026$0.3896$33,777,919.52$196,332.94
Nov 9, 2026$0.3570$30,956,045.33$40,423.83
Nov 8, 2026$0.3536$30,670,061.59$105,034.98
Nov 7, 2026$0.3331$28,907,160.70$67,434.76
Nov 6, 2026$0.3258$28,287,248.71$198,432.06
Nov 5, 2026$0.3262$28,345,541.46$231,203.90
Nov 4, 2026$0.3107$27,032,082.21$132,728.21
Nov 3, 2026$0.3027$26,375,426.98$117,591.79
Nov 2, 2026$0.3067$26,748,217.53$130,931.42
Nov 1, 2026$0.3122$27,240,708.05$207,413.96
Oct 31, 2026$0.3012$26,319,596.27$198,511.50
Oct 30, 2026$0.2994$26,204,154.65$134,347.19
Oct 29, 2026$0.3026$26,492,663.21$209,205.86
Oct 28, 2026$0.3057$26,778,252.07$125,074.58
Oct 27, 2026$0.3064$26,839,820.34$217,511.20
Oct 26, 2026$0.3059$26,801,925.26$128,222.96
Oct 25, 2026$0.3069$26,896,629.37$84,091.62
Oct 24, 2026$0.3091$27,102,916.02$98,865.53
Oct 23, 2026$0.3062$26,861,809.92$76,200.71
Oct 22, 2026$0.3132$27,478,548.77$140,604.25
Oct 21, 2026$0.3060$26,867,777.43$84,589.41
Cryptocurrency market information is provided for informational purposes only and is not financial advice.
Trustpilot

What our customers say

4.8 / 5Trustpilot rating
FREE BITCOIN TOOLS

Stuck Bitcoin transaction?

Paste your TXID, see where it stands, and give it a free push. No signup, no wallet access.

Try the free accelerator
  • Free
  • No signup
  • Live status